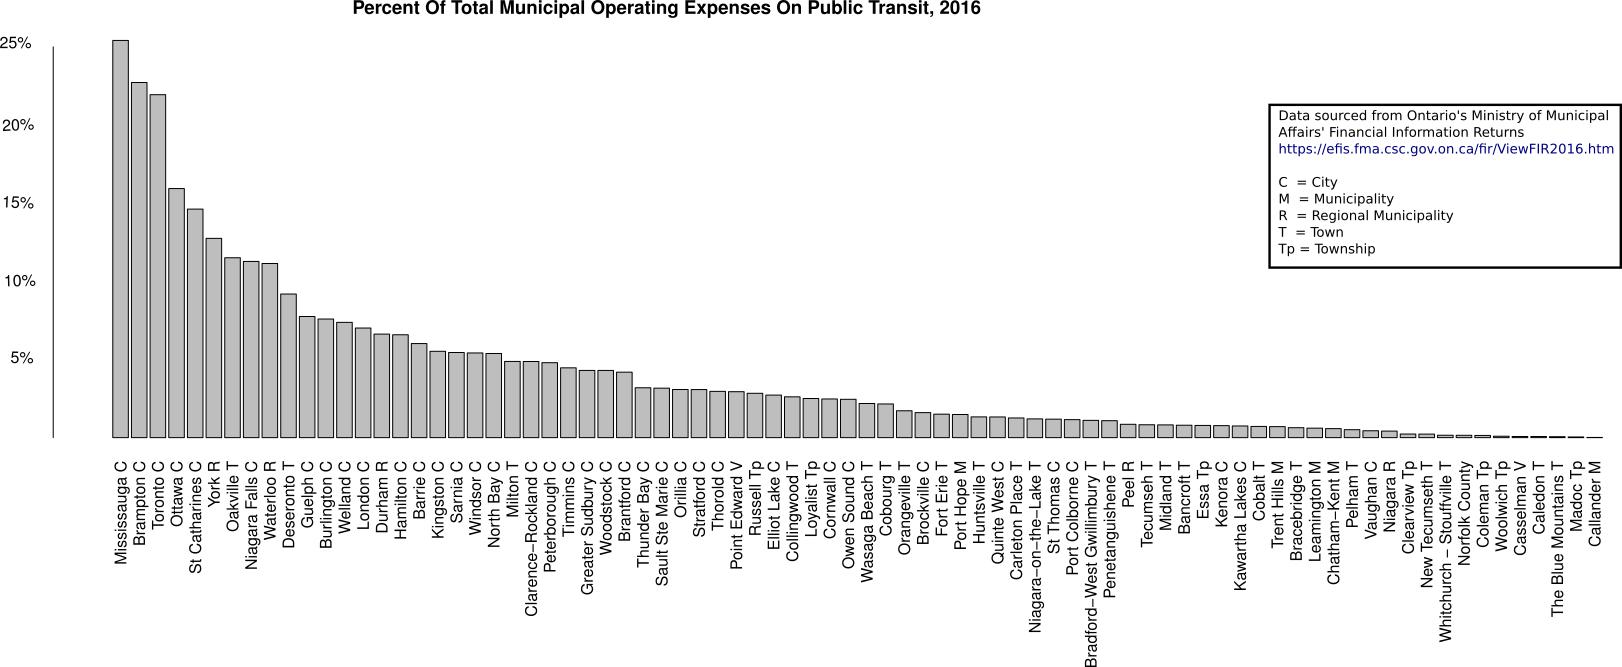
This data is compiled using the Ontario government's Financial Information Return's as collected by the Ministry of Municipal Affairs for the year 2016. This is data for total spending on conventional transit operating costs as percent of total operating expense for the municipality. Abbreviations; C = City, M = Municipality, R = Regional Municipality, T = Town, Tp = Township.
| Municipality | Total Operating Expenses | Transit Spending | Percent Of Operating Budget On Transit |
| Mississauga C | $820,424,017.00 | $208,491,189.00 | 25.41 |
| Brampton C | $734,021,241.00 | $166,780,412.00 | 22.72 |
| Toronto C | $10,953,870,285.00 | $2,403,263,394.00 | 21.94 |
| Ottawa C | $3,330,954,596.00 | $530,700,966.00 | 15.93 |
| St Catharines C | $165,200,073.00 | $24,155,808.00 | 14.62 |
| York R | $1,845,283,145.00 | $235,267,480.00 | 12.75 |
| Oakville T | $285,100,376.00 | $32,809,550.00 | 11.51 |
| Niagara Falls C | $157,795,627.00 | $17,786,566.00 | 11.27 |
| Waterloo R | $975,178,053.00 | $108,656,718.00 | 11.14 |
| Deseronto T | $3,921,675.00 | $360,249.00 | 9.19 |
| Guelph C | $396,478,178.00 | $30,720,198.00 | 7.75 |
| Burlington C | $247,428,368.00 | $18,767,343.00 | 7.58 |
| Welland C | $78,001,437.00 | $5,751,729.00 | 7.37 |
| London C | $1,020,041,898.00 | $71,513,253.00 | 7.01 |
| Durham R | $1,136,798,245.00 | $75,274,676.00 | 6.62 |
| Hamilton C | $1,657,033,962.00 | $109,008,019.00 | 6.58 |
| Barrie C | $365,939,947.00 | $22,017,099.00 | 6.02 |
| Kingston C | $436,053,830.00 | $24,082,938.00 | 5.52 |
| Sarnia C | $122,701,899.00 | $6,680,544.00 | 5.44 |
| Windsor C | $739,524,738.00 | $40,063,387.00 | 5.42 |
| North Bay C | $138,221,461.00 | $7,441,345.00 | 5.38 |
| Milton T | $107,837,536.57 | $5,258,410.79 | 4.88 |
| Clarence-Rockland C | $38,910,697.00 | $1,895,228.00 | 4.87 |
| Peterborough C | $283,968,708.00 | $13,616,260.00 | 4.79 |
| Timmins C | $133,950,314.00 | $5,980,180.00 | 4.46 |
| Greater Sudbury C | $539,115,930.00 | $23,187,710.00 | 4.30 |
| Woodstock C | $60,738,764.00 | $2,610,179.00 | 4.30 |
| Brantford C | $286,712,974.00 | $12,002,944.00 | 4.19 |
| Thunder Bay C | $528,836,012.00 | $16,875,016.00 | 3.19 |
| Sault Ste Marie C | $204,173,195.00 | $6,463,477.00 | 3.17 |
| Orillia C | $71,703,996.00 | $2,207,783.00 | 3.08 |
| Stratford C | $107,718,648.00 | $3,312,358.00 | 3.08 |
| Thorold C | $25,135,916.00 | $743,846.00 | 2.96 |
| Point Edward V | $6,481,404.87 | $190,557.91 | 2.94 |
| Russell Tp | $23,617,264.00 | $669,224.00 | 2.83 |
| Elliot Lake C | $24,600,271.00 | $669,566.00 | 2.72 |
| Collingwood T | $51,093,707.00 | $1,332,966.00 | 2.61 |
| Loyalist Tp | $29,041,283.00 | $726,681.00 | 2.50 |
| Cornwall C | $182,479,664.00 | $4,509,338.50 | 2.47 |
| Owen Sound C | $49,515,699.00 | $1,214,713.00 | 2.45 |
| Wasaga Beach T | $33,949,566.00 | $741,607.00 | 2.18 |
| Cobourg T | $43,041,166.00 | $927,643.00 | 2.16 |
| Orangeville T | $47,479,292.00 | $815,052.00 | 1.72 |
| Brockville C | $52,139,464.00 | $834,402.00 | 1.60 |
| Fort Erie T | $44,217,620.34 | $664,368.70 | 1.50 |
| Port Hope M | $31,877,313.00 | $472,147.00 | 1.48 |
| Huntsville T | $22,620,772.00 | $300,350.00 | 1.33 |
| Quinte West C | $77,661,560.00 | $1,025,991.00 | 1.32 |
| Carleton Place T | $21,679,936.00 | $272,971.00 | 1.26 |
| Niagara-on-the-Lake T | $27,637,794.00 | $331,559.00 | 1.20 |
| St Thomas C | $129,883,459.00 | $1,533,099.00 | 1.18 |
| Port Colborne C | $26,093,934.00 | $300,826.00 | 1.15 |
| Bradford-West Gwillimbury T | $65,588,443.00 | $724,384.00 | 1.10 |
| Penetanguishene T | $15,269,588.00 | $165,582.00 | 1.08 |
| Peel R | $2,145,440,938.00 | $18,291,455.00 | 0.85 |
| Tecumseh T | $35,306,733.00 | $291,126.00 | 0.82 |
| Midland T | $29,658,085.00 | $241,620.00 | 0.81 |
| Bancroft T | $8,988,319.00 | $71,249.00 | 0.79 |
| Essa Tp | $16,714,356.00 | $130,540.00 | 0.78 |
| Kenora C | $44,658,199.00 | $342,772.00 | 0.77 |
| Kawartha Lakes C | $199,186,905.00 | $1,483,375.00 | 0.74 |
| Cobalt T | $3,238,351.00 | $23,252.00 | 0.72 |
| Trent Hills M | $21,524,632.00 | $151,431.00 | 0.70 |
| Bracebridge T | $19,839,300.00 | $126,394.00 | 0.64 |
| Leamington M | $50,916,299.00 | $308,658.00 | 0.61 |
| Chatham-Kent M | $314,052,426.62 | $1,812,728.00 | 0.58 |
| Pelham T | $19,727,670.00 | $99,889.00 | 0.51 |
| Vaughan C | $435,951,959.00 | $1,913,533.00 | 0.44 |
| Niagara R | $842,735,975.00 | $3,499,515.00 | 0.42 |
| Clearview Tp | $19,453,051.00 | $44,930.00 | 0.23 |
| New Tecumseth T | $54,893,449.00 | $123,429.00 | 0.22 |
| Whitchurch - Stouffville T | $56,583,939.00 | $85,883.00 | 0.15 |
| Norfolk County | $178,926,610.00 | $263,260.00 | 0.15 |
| Coleman Tp | $1,784,105.00 | $2,500.00 | 0.14 |
| Woolwich Tp | $20,537,743.00 | $18,309.00 | 0.09 |
| Casselman V | $6,173,017.00 | $4,518.00 | 0.07 |
| Caledon T | $77,122,552.00 | $54,829.00 | 0.07 |
| The Blue Mountains T | $27,878,677.00 | $16,782.00 | 0.06 |
| Madoc Tp | $2,374,641.00 | $1,000.00 | 0.04 |
| Callander M | $6,611,864.00 | $895.00 | 0.01 |
| $33,645,024,737.40 | $4,281,573,154.90 | 12.73 |
The mean spending by a municipal level of government, that does spend on the operating costs of public transit, spends 12.73% of its total operating budget on public transit.
Bibliography
The Ministry of Municipal Affairs. (n.d.). FIR Data By Year - .CSV Format / Les donnees du RIF par annee - format .CSV. Ontario. Retrieved from https://efis.fma.csc.gov.on.ca/fir/MultiYearReport/MYCIndex.html